This article is prepared on the basis of MFSA Working Paper 20/05 by Theresa Fenech and George Zahra. The views expressed in this paper are the authors’ own and do not necessarily reflect the views of the Malta Financial Services Authority. Any errors are the authors’ own.
Linkages between financial institutions can amplify the effects of an adverse shock significantly, with the possibility of becoming systemic. It comes as no surprise that systemic risk has become paramount for central banks, supervisory authorities and researchers interested in financial stability. The MFSA has developed a financial sector network model that allows an in-depth assessment of contagion risk within the domestic financial system. The network methodology closely mirrors other works in the field, with the novelty being the unique data set used to test the model empirically. Using supervisory data, it was possible to estimate the model and carry out a number of simulations on a network made up of three different types of institutions: banks, insurance undertakings and investment funds which are linked together through a number of bi-lateral exposures. This rich data set covers granular exposures for 39 financial institutions which together account for over 66% of financial sector assets in Malta.
The flexibility embedded within the model allows simulations of the default of a single or group of institutions. Although simulation results are subject to significant simplifications, they give interesting insights for policy makers and supervisors. A high-level map of the interlinkage size and direction was constructed, providing a wide picture of connectivity within the financial services sector (see Figure 1). The representation is based on a Fruchterman-Reingold algorithm (Fruchterman and Reingold, 1991).
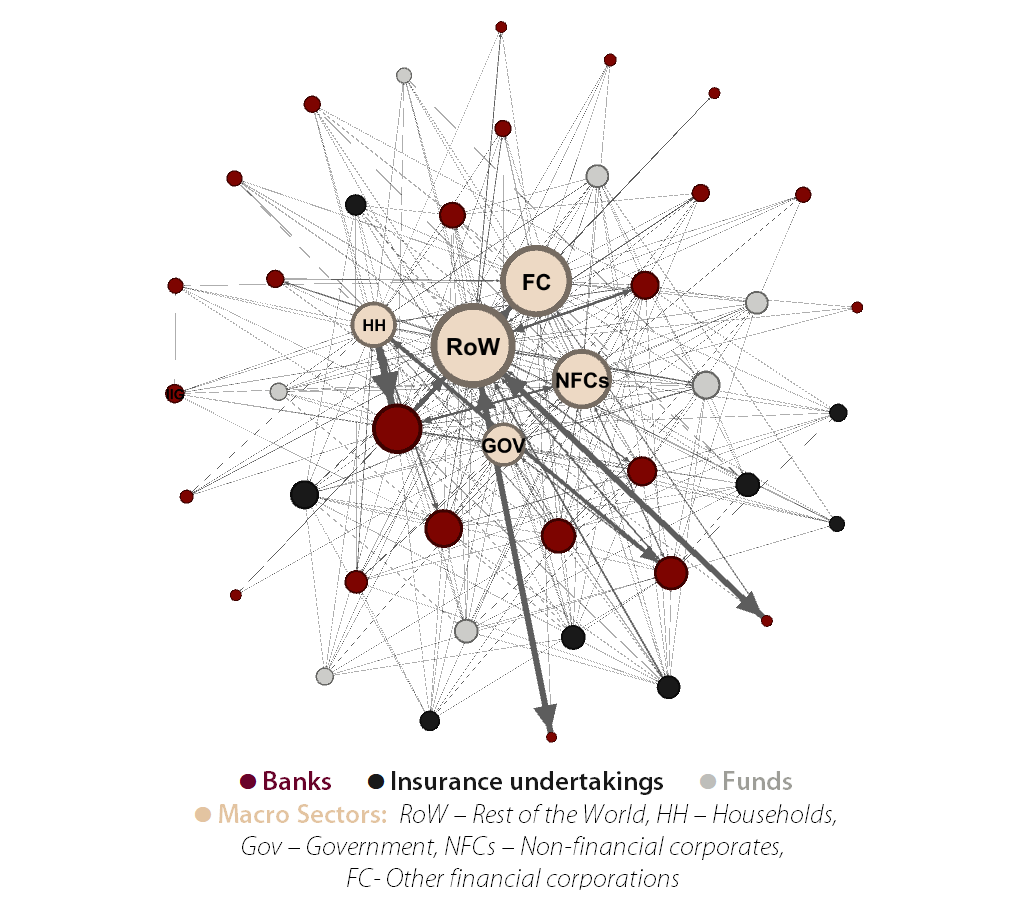
Figure 1: High level map of bi-lateral exposures (June 2019)
For ease of interpretation, the positioning of the nodes (representing individual entities) reflects the importance of entities within the network, such that central nodes hold stronger connections with the other nodes, while the edge weight (thickness of arrows) indicates the size of the exposure. The map is directed with the source being the asset holder. This means that an edge from one institution pointing towards another represents an asset for the first institution and a liability for the latter.
The map reflects certain known specificities of the domestic financial sector. The core domestic banks[1] lie at the centre of the sector, with most international banks being represented by peripheral nodes. The strongest links within the network are towards the rest of the world (RoW) by the two international bank branches which largely dominate the direction of international transactions within the banking industry. Both domestic investment funds, as well as domestic insurance undertakings, have fewer links with other institutions, thus also represented by nodes positioned at the periphery of the map. All the nodes are linked to the macro sectors which represent households (HH), non-financial corporates (NFCs), the government (GOV) and other financial corporations (FC).
The network model provides an understanding as to how a failure of an institution impacts other institutions through the equity, credit and funding channel mechanisms. These channels operate in the context of a sequential default mechanism, similar to that used by Espinosa-Vega and Sole (2010) and Covi, Gorpe and Kok (2019). Results from 39 simulations, representing the idiosyncratic default of each institution, were obtained and transformed into indicators that measure systemic relevance, systemic vulnerability and the loss amplification factor. These network metrics increase the usability of the network model for risk oversight purposes, allowing identification of institutions which pose the highest risk on financial stability.
Systemic Relevance Ondex (SRI) - a count of the number of institutions which suffer a loss greater than 5% of their book value following the failure of the player for which the index is being calculated.
Systemic Vulnerability Index (SVI) - a count of the number of instances when the institution for which the index is being calculated suffers a loss greater than 5% of its book value following the failure of another institution.
Loss Amplification Factor (LAF) - a ratio of the total losses incurred by all institutions in the network to the sum of the direct losses to the same institutions generated by the failure of the institution for which the factor is being calculated.
The domestic banks were found to have the highest systemic relevance while insurance undertakings ranked highest in terms of vulnerability, due to their links with both banks and investment funds in terms of deposits and equity holdings respectively. Moreover, the vulnerabilities in the insurance industry also capture insurance ownership links with certain domestic institutions.
The main interlinkage characteristics observed using the 2019 dataset remained relatively unchanged as compared to 2017. Nevertheless, it is interesting to note that although the average degree (the number of links) for banks declined significantly, a significant increase in the size (edge weight) of the exposures was observed. Also, core domestic banks have become more systemically relevant which indicates that although the number of links between institutions has decreased, the remaining larger linkages may cause more significant disruptions. These developments make it even more pertinent to investigate the potential impact of the failure of one institution on those which have links to it.
While these findings have interesting implications for supervisors and policy makers, they are to be interpreted with caution due to the simplifications underlying the model. Nonetheless, the absence of system-wide cascades supports the notion that contagion risk within the financial sector remains subdued. Results also suggest that direct linkages appear to be the most relevant with low amplification factors being recorded across the sample.
The granular dataset necessary for this analysis was collated using several cross-mapping procedures, with banking data obtained from the MFSA Banking Rule No. 6 (Br06) Schedules, investment funds data from the Central Bank of Malta Investment Funds Statistical Return and insurance undertakings data from the Solvency II Quantitative Reporting Templates. The data was collected as at June-2019 and is updated annually as part of the MFSA's financial stability assessment. A more detailed analysis of the current model and main findings is available on the MFSA website.
References
Espinosa‐Vega, M.A. & Solé, J., (2011). Cross‐border financial surveillance: a network perspective. Journal of Financial Economic Policy.
Fruchterman, T.M.J. & Reingold, E.M. (1991). Graph drawing by force‐directed placement. Softw: Pract. Exper., 21: 1129-1164
Gorpe, M.Z., Covi, G. & Kok, C., (2019). CoMap: mapping contagion in the euro area banking sector. International Monetary Fund.
[1] At the time of writing six banks were classified by local supervisory authorities as “core domestic banks” for financial stability purposes. These banks have the strongest ties with the domestic economy. A further five banks were classified as “domestic” while the remaining banks were classified as international due to their limited links with the domestic economy.