Capital Adequacy
The capital ratios for the aggregated group of significant institutions, i.e. the banks supervised by the ECB, increased in the fourth quarter of 2019 compared with the previous quarter. The Common Equity Tier 1 (CET1) ratio stood at 14.78%, the Tier 1 ratio at 15.96% and the total capital ratio at 18.43%. Average CET1 capital ratios at country level ranged from 12.21% in Spain to 28.07% in Estonia. G-SIBs showed the lowest CET1 capital ratios at 13.61% on average and development and promotional lenders the highest average, at 33.56%.
Chart 1
Total capital ratio and its components by reference period
(EUR billions, percentages)
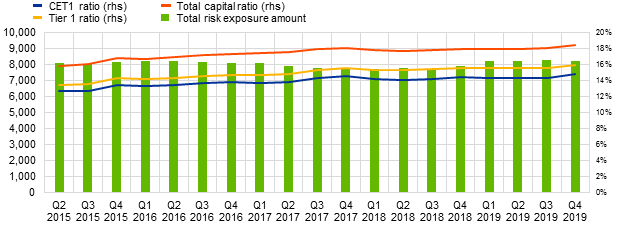
Source: ECB.
Chart 2
Capital ratios by country for the fourth quarter of 2019
(Percentages)
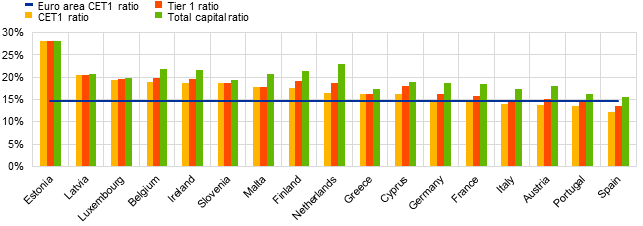
Source: ECB.
Note: For some countries participating in European banking supervision no data are displayed, either for confidentiality reasons or because there are no significant institutions at the highest level of consolidation in that country.
Chart 3
Capital ratios by business model for the fourth quarter of 2019
(Percentages)
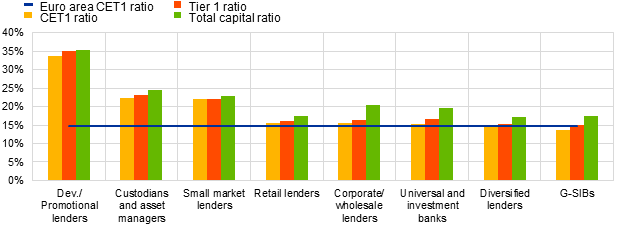
Source: ECB.
Note: Dev./Promotional lenders refers to development and promotional lenders; retail lenders refer to retail and consumer credit lenders.
Asset Quality
The non-performing loans ratio (NPL ratio) improved further, to 3.22%, in the fourth quarter of 2019. This was the lowest level since supervisory banking statistics were first published in the second quarter of 2015. Luxembourg had the lowest average ratio, at 0.78%, while Greece had the highest, at 35.15%. On average, custodians and asset managers reported the lowest NPL ratio, at 0.20%, while the average NPL ratio for diversified lenders stood at 7.76% in the fourth quarter of 2019.
Chart 4
Non-performing loans by reference period
(EUR billions, percentages)
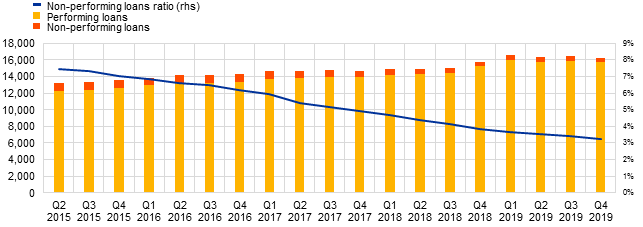
Source: ECB.
Chart 5
Non-performing loans ratio by country for the fourth quarter of 2019
(Percentages)
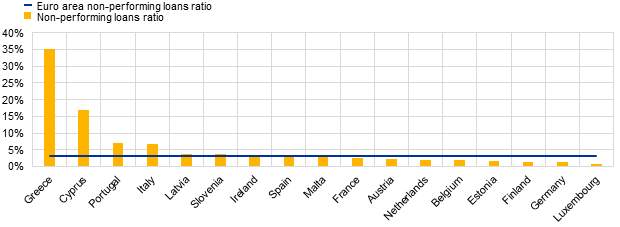
Source: ECB.
Note: For some countries participating in European banking supervision no data are displayed, either for confidentiality reasons or because there are no significant institutions at the highest level of consolidation in that country.
Chart 6
Non-performing loans ratio by business model for the fourth quarter of 2019
(Percentages)
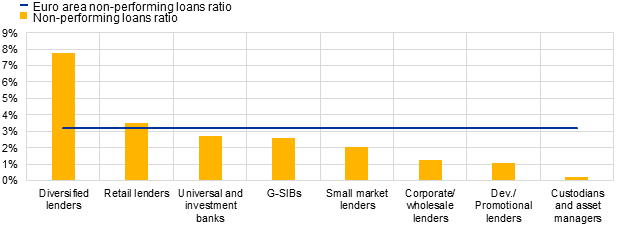
Source: ECB.
Note: Dev./Promotional lenders refers to development and promotional lenders; retail lenders refers to retail and consumer credit lenders.
Liquidity
The liquidity coverage ratio stood at 145.96% in the fourth quarter of 2019, up from 145.08% in the third quarter of 2019. The average values ranged from 130.25% in Greece to 355.06% in Slovenia. G-SIBs had the lowest average LCR, at 132.10%, while small market lenders had the highest, at 224.81%.
Chart 7
Liquidity coverage ratio by reference period
(EUR billions, percentages)
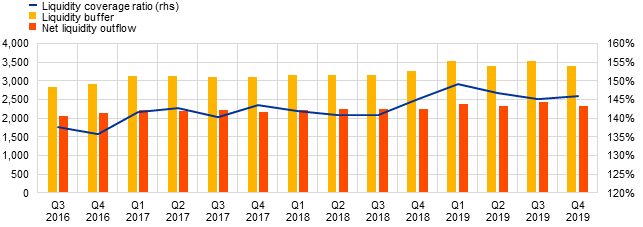
Source: ECB.
Chart 8
Liquidity coverage ratio by country for the fourth quarter of 2019
(Percentages)
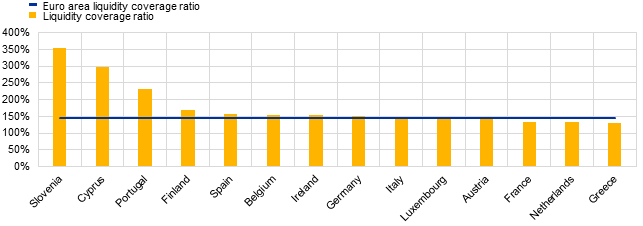
Source: ECB.
Note: For some countries participating in European banking supervision no data are displayed, either for confidentiality reasons or because there are no significant institutions at the highest level of consolidation in that country.
Chart 9
Liquidity coverage ratio by business model for the fourth quarter of 2019
(Percentages)
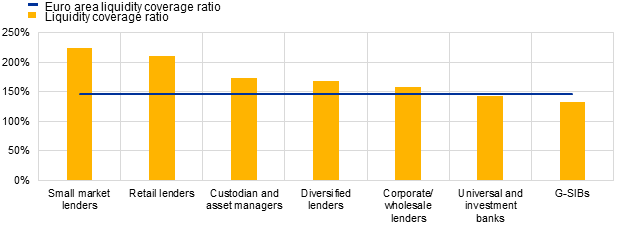
Source: ECB.
Note: Retail lenders refers to retail and consumer credit lenders.
Return on Equity
The Return on equity (RoE) stood at 5.20% in the fourth quarter of 2019, down from a 2018 level of 6.16%. The main income driver among SSM banks is net interest income, which represents a share of 58.55% to operational income. The share of net fee and commission income and net trading income stood at 31.28% and 8.55% in the fourth quarter of 2019, respectively. The average values for RoE ranged from 0.08% in Germany to 10.36% in Slovenia. The lowest average RoE is reported by custodians and asset managers, at 2.94%, while small market lenders report the highest, at 8.99%.
Chart 10
Return on equity and share of income drivers by reference period
(EUR billions, percentages)
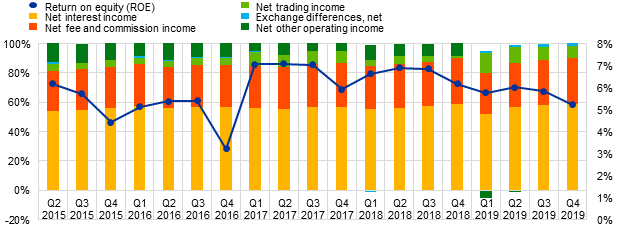
Source: ECB.
Chart 11
Return on equity and share of income drivers by country for the fourth quarter of 2019
(Percentages)
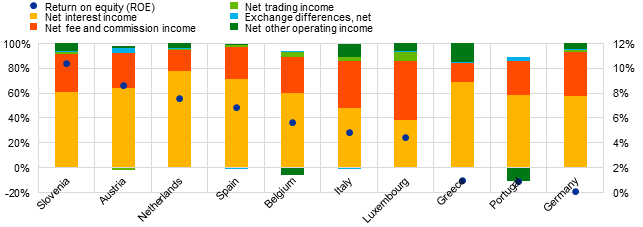
Source: ECB.
Note: For some countries participating in European banking supervision no data are displayed, either for confidentiality reasons or because there are no significant institutions at the highest level of consolidation in that country.
Chart 12
Return on equity and share of income drivers by business model for the fourth quarter of 2019
(Percentages)
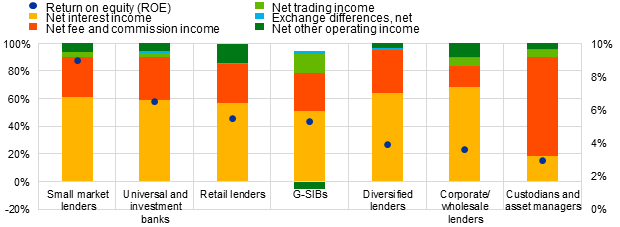
Source: ECB.
Factors Affecting Changes
Supervisory banking statistics are calculated by aggregating data reported by banks that report COREP (capital adequacy information) and FINREP (financial information) at that point in time. Changes in the amounts shown from one quarter to another can be influenced by the following factors:
- changes in the sample of reporting institutions;
- mergers and acquisitions;
- reclassifications (e.g. portfolio shifts owing to certain assets being reclassified from one accounting portfolio to another).
Link to Full Press Release - Click here.